The energy-economy interaction of PEP 2000 followed almost the same trend of the PEP 1999 with the minimal differences attributed to the revision in economic targets due to the lower-than expected performance in 1998. The PEP 1999 forecasts a 5.1% average growth in energy consumption in the medium term, 1998-2004, and a slightly higher figure of 5.7% during the entire planning period, 1999-2008 (Table 4). If one is to appreciate these figures, it is important to put them in the context of past interaction between the planning parameters.

Between 1983 and 1997, the Philippines registered a robust energy consumption growth of 7% corresponding to a 5% annual growth in GDP, translating to an energy-to-GDP growth ratio or elasticity of 1.5. From 1997 to 1999 wherein for the most part the Philippines was affected by the Asian financial crisis, a much lower energy-to-GDP elasticity was seen, largely due to the negative growth in petroleum consumption, which is attributed to the slowdown in industrial production. Growth in electricity generation was high relative to GDP, but the residential or the consumptive rather than the productive industrial sectors drove most of the consumption growth.
On the other hand, during the period 1989-1993 when the Philippines experienced severe power outages, petroleum consumption was very high relative to GDP growth, but this was because of the over-dependence on diesel-fired gas turbines at the time.
As mentioned earlier, the above forecasts have been revised with GDP targets slightly scaled down as actual 1998 growth was lower than expected and recovery from the Asian financial crisis may not be faster than earlier predicted. Oil prices have also soared dramatically compared to the previous assumptions. At the same time, the peso has significantly devalued relative to the dollar and other major international currencies. However, as seen during the 1993-1997 era, high oil prices or large forex devaluation did not dampen energy demand in a robust economic situation. Thus, under normal circumstances, energy consumption trends should be higher than what are currently projected.
Total Primary Energy Supply
To meet the demand projection, the country’s total primary energy supply (TPES) is projected to grow at an annual average rate of 6.3% or to almost double from about 245 million barrels of fuel-oil-equivalent (MMBFOE) in 1999 to about 444 MMBFOE by 2009 (Table 5).
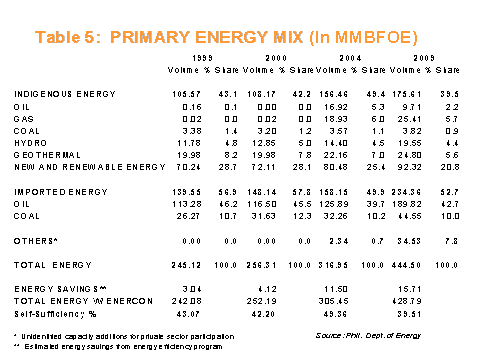
Of the TPES, imported oil share will significantly decline to 43% mainly due to the increased contributions from natural gas and geothermal resources. The natural gas component is expected to reach 25.4 MMBFOE or 5.7 % by 2009 from almost nil at present.
The share of indigenous energy resources in the energy mix is seen to rise from 42.2% in 2000 to 49.4% in 2004 with the bulk of the increase contributed by natural gas from offshore Palawan Island (Malampaya). In the second period (2005-2009), however, energy demand is seen to grow more rapidly than the rate of indigenous energy production. Thus, and unless development of indigenous energy is hastened, the share of indigenous resources may decline to 39.5% by the end of the planning period.
New and renewable energy sources (NRES), mostly traditional fuels such as fuelwood, agriwastes and bagasse, account for a major share of indigenous energy production, i.e., 29% in 1999 and going down to 21% by 2009 because of the growth in other domestic sources. NRES applications are mainly confined to providing energy resources in remote villages that are inaccessible to electricity and petroleum distribution networks.
Power Supply and Demand Profile
The power expansion program targets a massive displacement of oil-based power plants with their share in the power generation mix declining to 19% in 1999 and to only 7% by 2009 (Table 6).
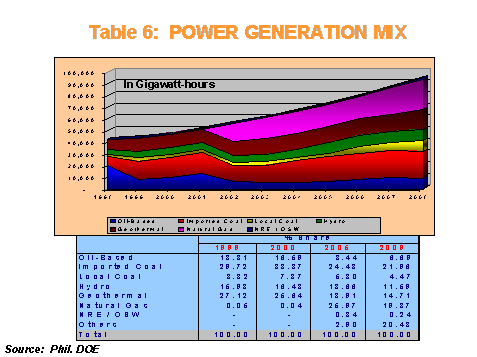
With the coming on-stream of natural gas from the Malampaya natural gas field starting 2002, gas share in the power generation mix will be at a maximum of 26% in 2005 from its very minimal contribution of 0.08% in 1999. These figures represent only the generation in the areas connected to the main grid. The Department foresees substantial capacity additions from NRES to provide distributed power systems in areas that cannot be economically connected to the main electricity grid.
